Even though online marketing is much more measurable than billboards, TV and magazine ads, it can still be hard to show the results of your work. Many standard dashboards and reporting tools don't show the real value of the campaign— screenshots of monthly visitor traffic don't tell the whole story. And if you're a technical SEO, relentlessly asking development to make significant changes to the website to support new things like AMP or schema markup, you're swimming against the current.

To help you create more value in your role and clearly show that value to others, here are five great reports for search marketers (and one you need to stop using):
1. Conversion Paths (Google Analytics)
It is super frustrating when you run a fantastic campaign that's bringing in loads of leads and/or sales and one of your stakeholders says: "But it looks like all these leads/sales are coming as direct traffic, not the stuff you do."
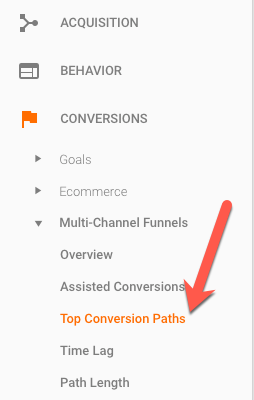
When you encounter this kind of "what are you spending my budget on" push-back, your first report should be the Conversion Paths report in Google Analytics.
You can find it under Conversions > Multi-Channel Funnels > Top Conversion Paths
Conversion data is reported throughout Google Analytics (if you've set up your goals) but will by default show the conversion as being attributed to the last interaction the user had with the site. This doesn't tell the whole story, especially if you have a conversion funnel with multiple touch points with visitors coming back to the site multiple times and from multiple sources.
It's not uncommon for people to come through one source, leave, come back through another, leave, come back again, and then complete the conversion. Instead of the Visit Site > Make a Purchase conversion path, it looks more like this:
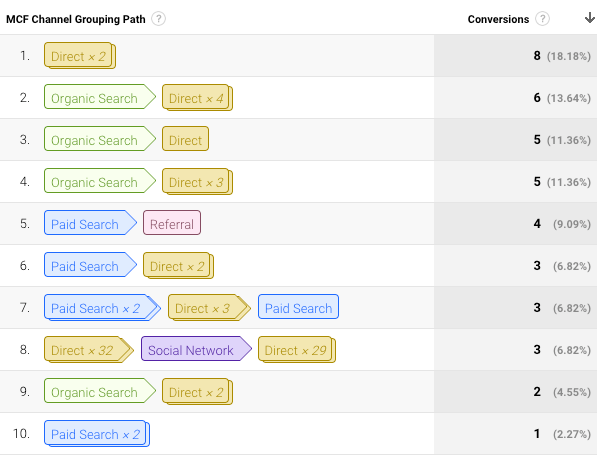
Looking at this chart, 7 of these 10 conversion paths have "Direct" as the last source of the visit before the conversion (80% of these conversions). However, if we look at direct traffic as a first point of contact, only 2 of the 10 should get first interaction credit (28% of these conversions).
Using last interaction attribution, our marketing initiatives start to look pretty pathetic. Being able to show that your search marketing is working to bring people into the site for the first time and build brand recognition so they can come back Direct can show the value of your work.
2. SERP Features Rankings (Moz)
I don't like to include tools that you have to pay for on lists like this, but Moz really gets it right in their SERP Features report. This report shows you all of your tracked keywords that trigger a search results page with a featured result (images, ads, videos, local business listing, reviews, etc.) and it tells you if you or your competitors were featured in those results. This is huge for identifying your ranking gaps.
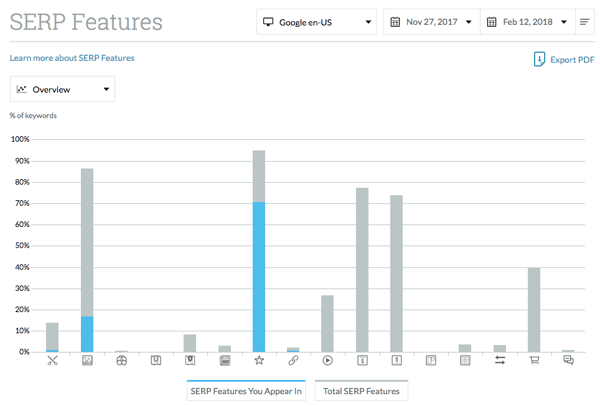 This website is doing great for reviews in the search results but is really missing the boat on image search, videos and shopping search. They should also check to see who is bidding on all those keywords in Google Ads to identify their competitors with deep pockets.
The information from the SERP Features report is going to help drive your strategy and identify your weaknesses. It also provides data-backed support so people stop ignoring you when you say that you need to go through and optimize 10,000 product images.
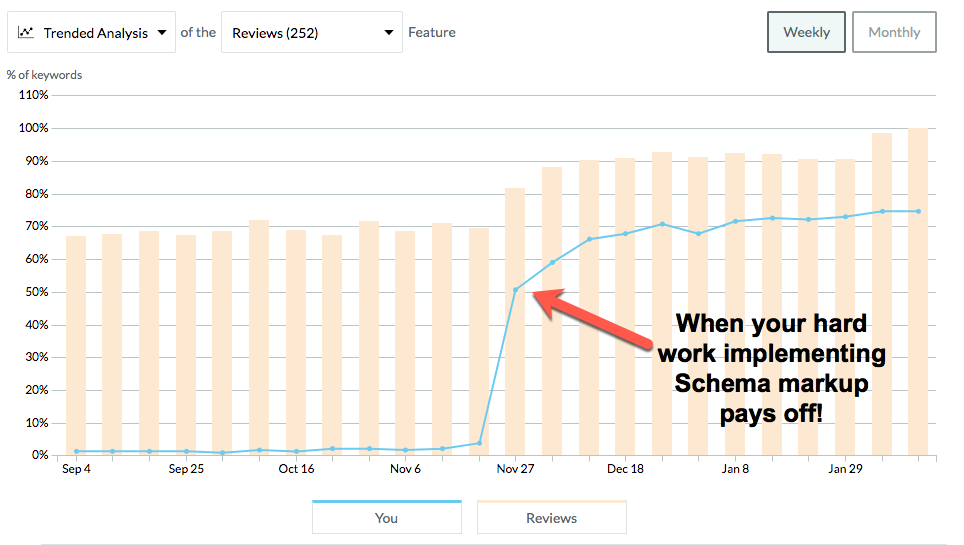
Added bonus: Moz will show you ranking changes over time for each of the SERP Features so you can show actual progress to your clients.
3. Search Impression Share (Google Ads)
The default columns in Google Ads reports are weak. You can't gain much insight from them without modifying the columns to add in your actual KPIs. But aside from adding in conversion metrics, what else can you do to better optimize those costly ad campaigns? Cue the search impression share column:

We often talk about online marketing as if the 'sky is the limit' and 'as long as it's profitable you can keep increasing the budget' but in actual practice, it doesn't really work that way. If you're barely scraping 10% of the impressions you're missing out on a lot of opportunities. If you're hitting 80%+ market share you (have an amazing budget and/or a super tiny niche) and you're likely over saturating that market. Also, if you're maxing out on your search impression share it may mean that you're not spending your full budget and you have some extra funds to move elsewhere.
Pro tip: you can also see search impression share for your product groups in your shopping campaigns.
4. AMP Traffic to Your Website (Google Search Console)
Google AMP is great for increasing mobile website traffic, but it's not great for analytics. Turns out, stripping the extra code on content pages means there is a lot of data not being included in your Google Analytics reports! Thankfully, Google owns every property that we use for the internet* and freely share this data with us**. If you pop on over to your Google Search Console you'll be able to see some of your AMP data.
When you're in Google Search Console go to Search Traffic > Search Analytics and under "Search Appearance" you'll have the option to filter for AMP results.
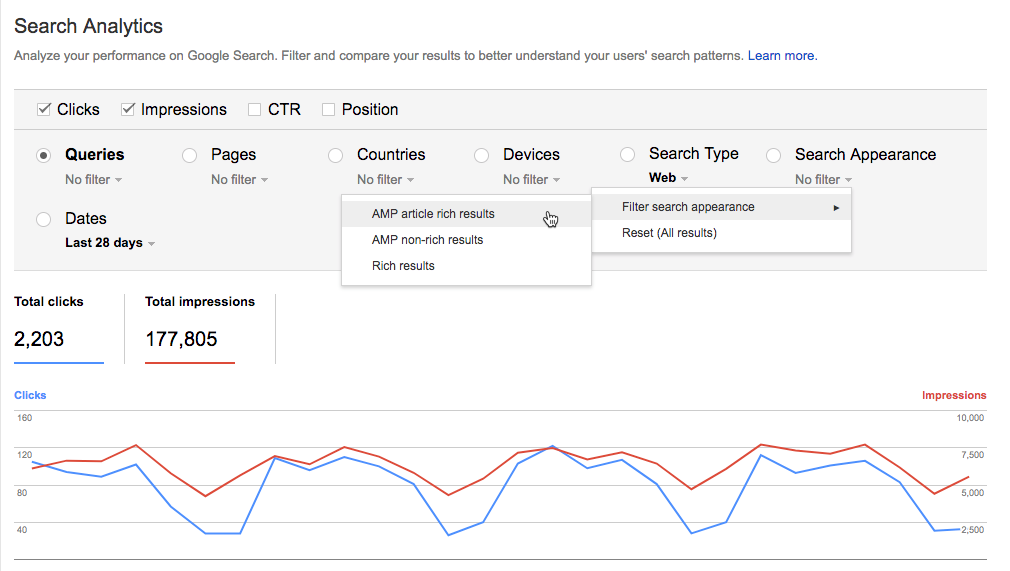
Then, take it one step further. Look at your website impressions and clicks for mobile devices and compare the AMP vs non-AMP impressions and clicks. For many of our clients, AMP traffic is upwards to 80% of mobile traffic. This is HUGE and not something easily findable in Google Analytics (yet).
Troubleshooting: a lot of data gets missed because the site you verified in Google Search Console is http and the one you're using for Analytics is https. Or reverse. Or you've verified them both as http but your site is actually https now so your Google Search Console doesn't show much data. If you haven't checked these settings lately, go do that right now.
5. Affinity Categories (Google Analytics)
Now that you've identified your weak points, tweaked your campaigns, and shown value to all stakeholders, they're throwing their advertising dollars at you. You need to find the right place to spend it. A good place to get inspiration is with the Affinity Categories report in Google Analytics which you can find under Audience > Interests > Affinity Categories.
Affinity audiences are groups of people with similar interests, passions, and lifestyle based on their online behaviors and demographics. This report can open your eyes to new ways to market to your existing audience (entrepreneurs falling strongly into the "Value Shoppers" affinity category, for instance) or they can help to reaffirm what you've suspected but didn't previously have data to support (the recreational marijuana store has an audience that's into fast food and movies).
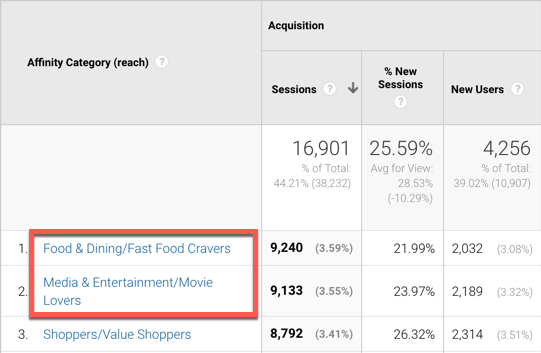 Armed with this data we can do some pretty stealth display ads and tailor the message of those ads to speak to the interests of that audience.
Bonus tip: if you have the conversion data, look at which Affinity Categories are the big spenders. Those are the ones you really want to hone in on.
The One Report We All Use, But Shouldn't
Keyword Rankings.
We need to stop focusing so much on keyword rankings and here's why:
- they often don't take into account the variety of listings in the SERP results
- your ranking tools don't reflect the degree of personalization that happens with each search
- really, based on that personalization, your rankings for a given keyword will vary wildly and the number in your report is unreliable
- voice searches are complex and diverse and you're likely totally missing out by focusing on concise keyword phrases
- instead of focusing on the keyword we need to focus on the intent of the search
Will I give up my keyword ranking reports? Not likely. Not until they've all been forcefully taken away from me. There is still a lot of great value to be pulled from them. However, the sooner you can start weaning your clients off those keyword lists and showing the value of diversified results and high converting traffic, the more successful your marketing efforts will be.
*Unverified claim and possibly not true.
**Until they don't want to *cough* (not provided)
